There is a common saying on Wall Street “Let winners run and cut losers short.” This quote tries to express the principle of creating big wins or small losses. Creating a high risk/reward ratio through the use of trailing stops for profitable trades and stop losses for unprofitable trades is the foundation of profitable trading. […]
Tag Archives: stock trading
Before you can trade you must first have a trading plan. A trading plan is written while the market is closed to tell you what to do when the market is open. A trading plan tells you how to specifically execute your trading system in real time with real money. A trading plan forces discipline […]
Smart money in the financial markets is considered to be capital traded or invested by experienced and educated professionals that are connected to better research on fundamentals or access to higher speed technology that gives them a technical edge over retail traders. There is little evidence to support the smart money edge as the majority […]
Profitable trading is not about opinions, not about a prediction, or even great stock tips or picks. Profitable trading is all about math, making more money on profitable trades than you lose on unprofitable trades. How you do this is the details. Trading without understanding the math creates randomness and luck in your process. Understanding […]
If the stock market is in an up trend trade primarily on the long side and in a down trend short rallies primarily. The best way to lose money in the stock market is to fight the prevailing trend. Do not trade without a detailed trading plan covering entries, exits, position sizing, maximum positions at […]
Credit: Excellent share by @promarketwizards
Gaps on a chart show that there were no buyers and sellers connecting at price levels on a chart. Gaps happen mostly when news comes out that instantly changes prices to much higher or lower prices than they were previously trading at. As the news event is instantly priced in by buyers and sellers a […]
Credit: Ian Cassel
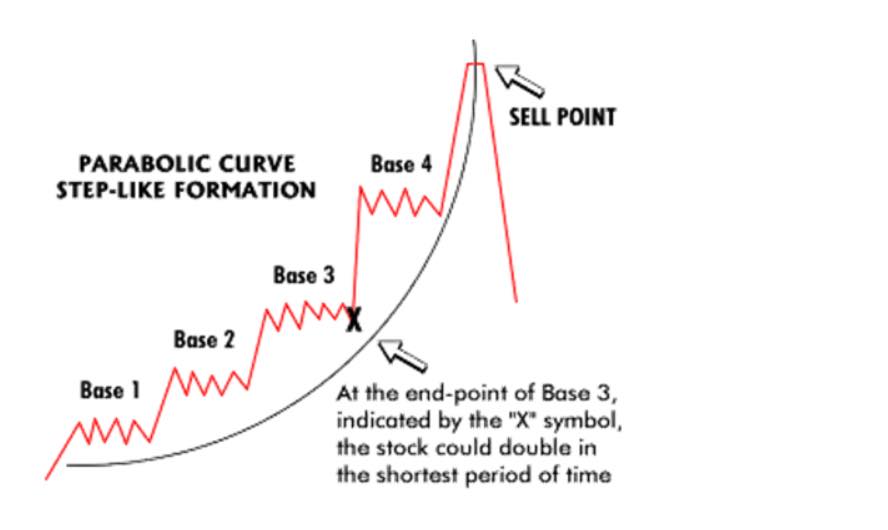
The parabolic curve chart pattern is one of the strongest uptrend patterns a stock can have. This type of pattern goes up the farthest and the fastest as it is under the strongest accumulation and every small pullback is bought by eager traders and investors. The parabolic curve is named after the parabola, because the […]


